Dashboard
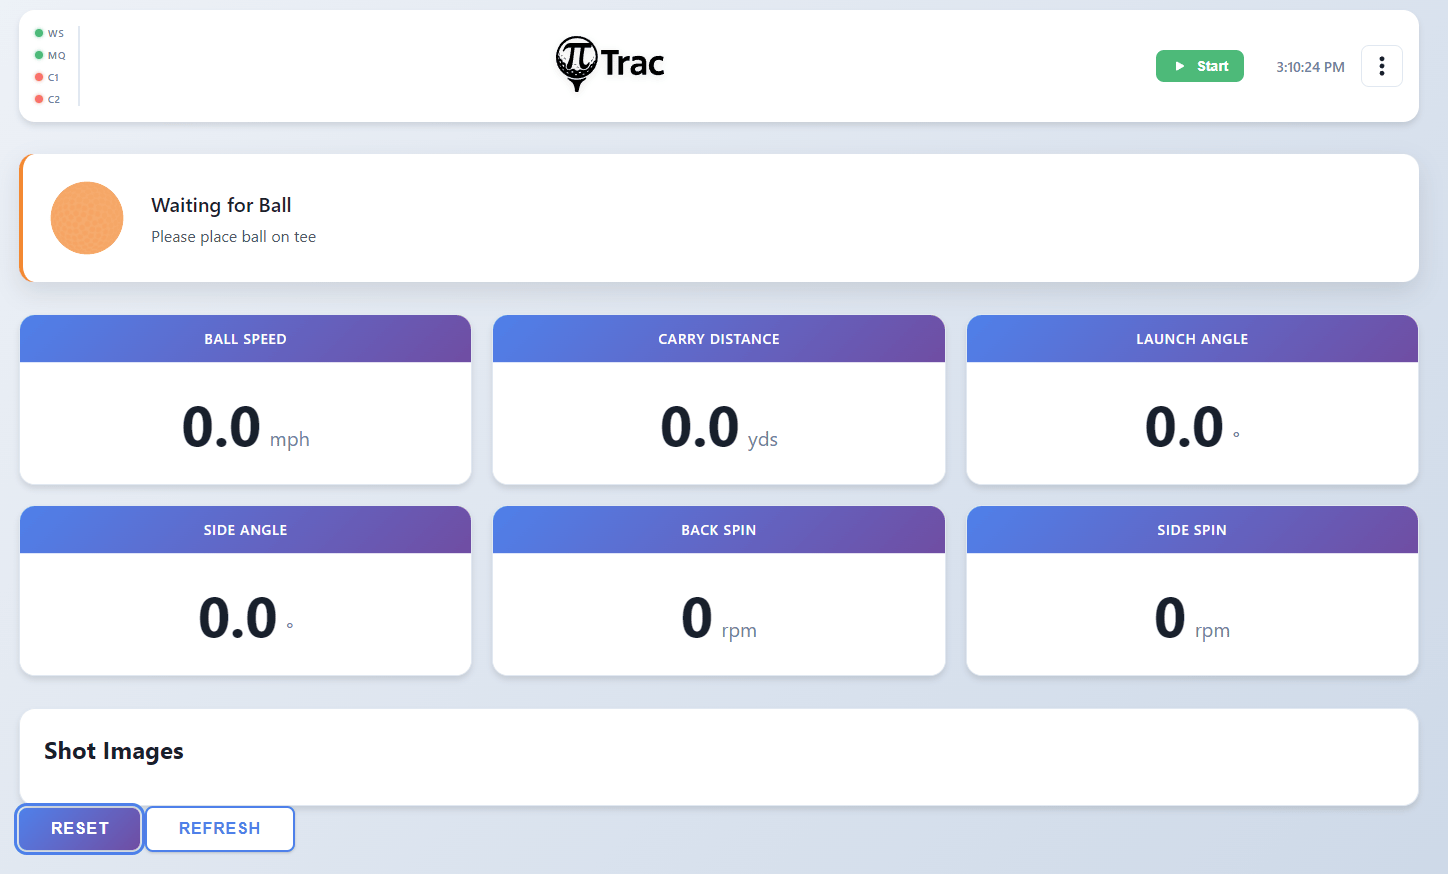
The dashboard is the main page at /. It displays real-time shot data received via WebSocket.
Status Strip
The status strip spans the top of the dashboard and shows the current system state. It changes color and message based on the result_type field from the C++ process:
| State | Color | Message |
|---|---|---|
| System Stopped | Red | PiTrac is not running |
| System Initializing | Pulse | Starting up PiTrac system... |
| Waiting for Ball | Blue | Please place ball on tee |
| Waiting for Simulator | Blue | Waiting for simulator to be ready |
| Ball Detected | Amber | Waiting for ball to stabilize... |
| Ready to Hit! | Green | Ball is ready, take your shot |
| Ball Hit! | Green | Processing shot data... |
| Multiple Balls Detected | Red | Please remove extra balls |
| Error | Red | An error occurred |
When a hit is detected, a Reset button appears on the status strip. Clicking it calls POST /api/reset to clear the shot data and image.
Metrics Panel
The left column shows shot metrics in a card layout:
- Ball Speed (hero card, large), displayed in mph
- Launch Angle, degrees
- Side Angle, degrees
- Back Spin, rpm
- Side Spin, rpm
Metrics animate briefly when updated. When PiTrac is not running, the metrics panel is dimmed (opacity 0.3).
Shot Image Panel
The right column displays the shot image. When a shot is captured, the C++ process sends an image notification via POST /api/internal/image-ready, and the dashboard displays the image. Click the image to open it full-size in a new tab.
When no image is available, the panel shows "Hit a shot to see the image here."