title: Using PiTrac description: Day-to-day operation of the PiTrac web dashboard, with one page per UI screen: dashboard, configuration, calibration, testing, logs, and system update.
Using PiTrac
The PiTrac web interface runs on the Pi at {PI-IP}:8080. This section documents each page of the interface, plus the shared header and navigation that appear across all of them.
Reaching the Web Interface
The web interface is at http://{PI-IP}:8080.
If the page does not load, two things to check first:
- Is the PiTrac web service running?
- Verify with
systemctl status pitrac-web. Start it withsudo systemctl start pitrac-web.
- Verify with
- Are you visiting the right address?
- Verify the IP address on the Pi with
ifconfigand look for your configured interface with a local IP address. - On the Pi's own desktop environment, use
localhostor127.0.0.1. - Always use
http://. HTTPS support is not implemented.
- Verify the IP address on the Pi with
Header and Navigation
The header bar appears on every page and provides navigation, status monitoring, and PiTrac process control.
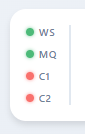
Status indicators (left side of header):
| Indicator | Label | Meaning |
|---|---|---|
| Green dot | WS | WebSocket connection to the server is active |
| Red dot | WS | WebSocket is disconnected (will auto-reconnect) |
| Green dot | LM | PiTrac launch monitor process is running (shows PID in tooltip) |
| Red dot | LM | PiTrac launch monitor is stopped |
These indicators poll the server every 5 seconds via /health and /api/pitrac/status.
PiTrac controls (desktop: visible in header; mobile: inside dropdown menu):
- Start calls
POST /api/pitrac/startto launch thepitrac_lmbinary. - Stop calls
POST /api/pitrac/stopto send SIGTERM (then SIGKILL if needed). - Restart stops then starts the process.
When PiTrac is stopped, only the Start button is visible. When running, only Stop and Restart are shown.
Strobe safety gate
On V3 Connector Boards, Start and Restart check strobe safety first (GET /api/strobe-safety). If the V3 DAC is not calibrated, a modal dialog blocks the action and directs you to the Calibration page.
Dropdown menu (three-dot icon, top right):
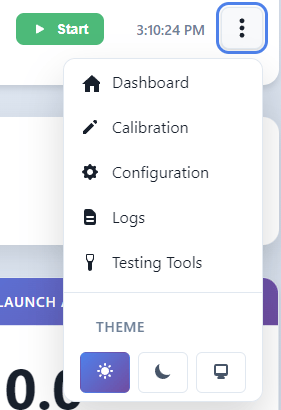
The dropdown provides navigation to all pages and a theme selector:
- Dashboard (
/) - Calibration (
/calibration) - Configuration (
/config) - Logs (
/logs) - Testing Tools (
/testing) - Theme: Light / Dark / System (persisted to
localStorage)
Pages
-
Real-time shot data via WebSocket. Status strip, metrics panel, shot image.
-
Settings editor. Camera types, lens choice, gains, simulator connection.
-
Camera calibration wizard and strobe (DAC) calibration for V3 boards.
-
Image pipeline tests, still capture, ball location checks, connectivity tests.
-
Real-time log streaming over WebSocket for PiTrac and the web server.
-
Pull the latest code from GitHub and rebuild PiTrac from the browser.